The BSCS is moving to a new graph for pen cards for all animals at Society sales. The new graph has been available for sometime as part of the Breedplan package used for performance recording and includes more detailed information on individual EBV values compared to the old graph. The new graph allows the buyer to see clearly where the animal’s individual traits fall in relation to breed average and also include the accuracy value.
Of course, as the EBV takes into account all the pedigree and performance information that is available at this point in time, the EBV is also the most reliable indication available of the animals breeding value for each trait at this point in time.
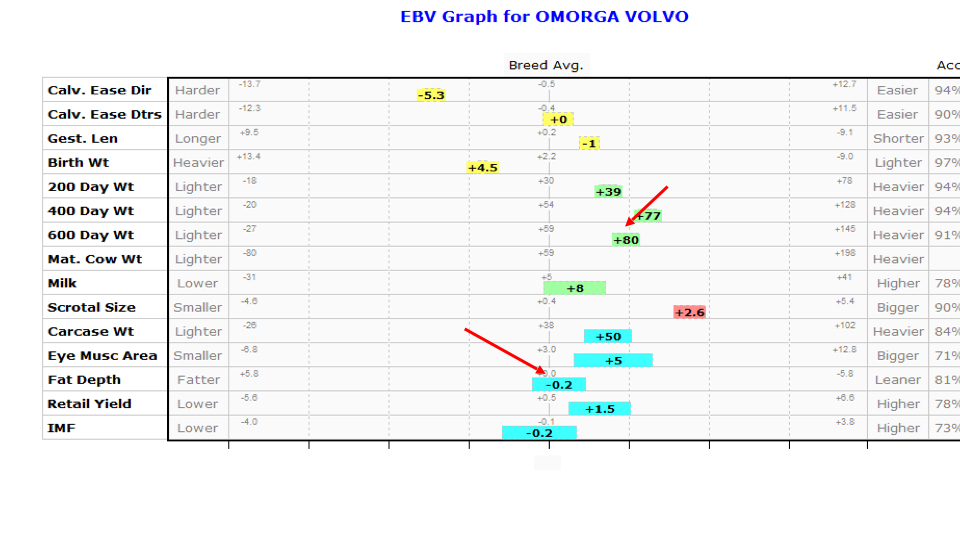
Within the display of the EBV Graph:
- The actual EBV Accuracy for each trait is shown at the right side of the graph.
- The Breed Avg values are listed in the centre of the graph and reflect the average EBV’s of current animals within the breed (ie. all 2 year old animals).
- The minimum and maximum EBV values are displayed at the left and right of the graph for each trait represented
- The horizontal bar (shaded/coloured area) displays where the animal is placed in relation to the current animals within the breed for each trait.
- As an illustration of the interpretation of the EBV graph, in the example below the animals 400 Day Wt EBV is of higher accuracy than the Eye Muscle Area EBV (because it’s horizontal bar is much narrower) and so there is less possible change in the 400 Day Wt EBV as additional information becomes available. Conversely, the EMA EBV may change when additional information becomes available.